[←][→] ath
| functional annotation | |||||||||||||||||||||||||||||||||||||||
| Function | F-box and associated interaction domains-containing protein |


|
|||||||||||||||||||||||||||||||||||||
| GO BP |
|
||||||||||||||||||||||||||||||||||||||
| GO CC |
|
||||||||||||||||||||||||||||||||||||||
| GO MF |
|
||||||||||||||||||||||||||||||||||||||
| KEGG | |||||||||||||||||||||||||||||||||||||||
| Protein | NP_566322.1 | ||||||||||||||||||||||||||||||||||||||
| BLAST | NP_566322.1 | ||||||||||||||||||||||||||||||||||||||
| Orthologous | [Ortholog page] LOC7455978 (ppo) LOC7458266 (ppo) LOC11406301 (mtr) LOC11423932 (mtr) LOC11438446 (mtr) LOC25486688 (mtr) LOC25498234 (mtr) LOC100261870 (vvi) LOC101258441 (sly) LOC103859247 (bra) LOC112941474 (sly) | ||||||||||||||||||||||||||||||||||||||
| Subcellular localization wolf |
|
||||||||||||||||||||||||||||||||||||||
| Subcellular localization TargetP |
|
||||||||||||||||||||||||||||||||||||||
| Gene coexpression | |||||||||||||||||||||||||||||||||||||||
| Network*for coexpressed genes |
|
||||||||||||||||||||||||||||||||||||||
|---|---|---|---|---|---|---|---|---|---|---|---|---|---|---|---|---|---|---|---|---|---|---|---|---|---|---|---|---|---|---|---|---|---|---|---|---|---|---|---|
| Coexpressed gene list |
[Coexpressed gene list for AT3G07870] | ||||||||||||||||||||||||||||||||||||||
| Gene expression | |||||||||||||||||||||||||||||||||||||||
| All samples | [Expression pattern for all samples] | ||||||||||||||||||||||||||||||||||||||
| AtGenExpress* (Development) |
258647_at
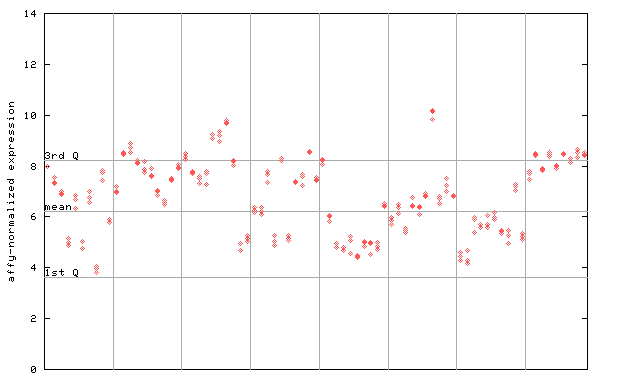
X axis is samples (pdf file), and Y axis is log2-expression. |
||||||||||||||||||||||||||||||||||||||
| AtGenExpress* (Stress) |
258647_at
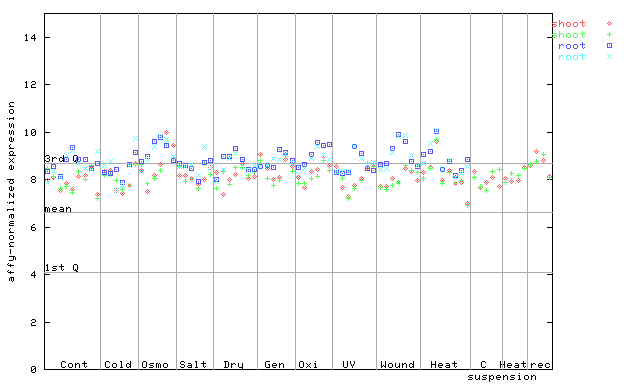
X axis is samples (pdf file), and Y axis is log2-expression. |
||||||||||||||||||||||||||||||||||||||
| AtGenExpress* (Hormone) |
258647_at
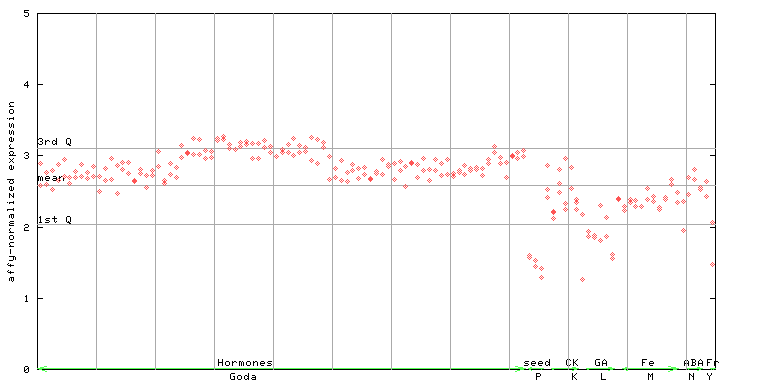
X axis is samples (xls file), and Y axis is log-expression. |
||||||||||||||||||||||||||||||||||||||


")
| Link to other DBs | ||
| Entrez Gene ID | 819978 |
|
| Refseq ID (protein) | NP_566322.1 | |
The preparation time of this page was 1.0 [sec].