[←][→] ath
| functional annotation | ||||||||||||||||||||||||||||||||||||||||||||
| Function | P-loop containing nucleoside triphosphate hydrolases superfamily protein |


|
||||||||||||||||||||||||||||||||||||||||||
| GO BP |
|
|||||||||||||||||||||||||||||||||||||||||||
| GO CC |
|
|||||||||||||||||||||||||||||||||||||||||||
| GO MF |
|
|||||||||||||||||||||||||||||||||||||||||||
| KEGG | ath03040 [list] [network] Spliceosome (192 genes) |  |
||||||||||||||||||||||||||||||||||||||||||
| Protein | NP_001077571.1 NP_001322011.1 NP_001322012.1 NP_001322013.1 NP_001322014.1 NP_001322015.1 NP_173516.1 | |||||||||||||||||||||||||||||||||||||||||||
| BLAST | NP_001077571.1 NP_001322011.1 NP_001322012.1 NP_001322013.1 NP_001322014.1 NP_001322015.1 NP_173516.1 | |||||||||||||||||||||||||||||||||||||||||||
| Orthologous | [Ortholog page] AT3G09620 (ath) LOC4344682 (osa) LOC4344716 (osa) LOC7471740 (ppo) LOC7494729 (ppo) LOC11418819 (mtr) LOC100262258 (vvi) LOC100381523 (zma) LOC100784306 (gma) LOC100806467 (gma) LOC101254580 (sly) LOC103870532 (bra) LOC103872879 (bra) | |||||||||||||||||||||||||||||||||||||||||||
| Subcellular localization wolf |
|
|||||||||||||||||||||||||||||||||||||||||||
| Subcellular localization TargetP |
|
|||||||||||||||||||||||||||||||||||||||||||
| Gene coexpression | ||||||||||||||||||||||||||||||||||||||||||||
| Network*for coexpressed genes |
|
|||||||||||||||||||||||||||||||||||||||||||
|---|---|---|---|---|---|---|---|---|---|---|---|---|---|---|---|---|---|---|---|---|---|---|---|---|---|---|---|---|---|---|---|---|---|---|---|---|---|---|---|---|---|---|---|---|
| Coexpressed gene list |
[Coexpressed gene list for AT1G20920] | |||||||||||||||||||||||||||||||||||||||||||
| Gene expression | ||||||||||||||||||||||||||||||||||||||||||||
| All samples | [Expression pattern for all samples] | |||||||||||||||||||||||||||||||||||||||||||
| AtGenExpress* (Development) |
262851_at
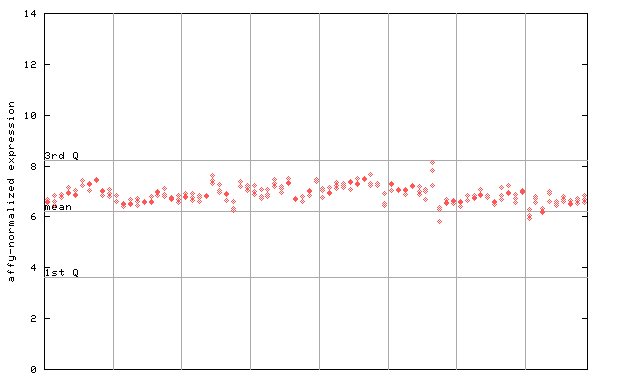
X axis is samples (pdf file), and Y axis is log2-expression. |
|||||||||||||||||||||||||||||||||||||||||||
| AtGenExpress* (Stress) |
262851_at
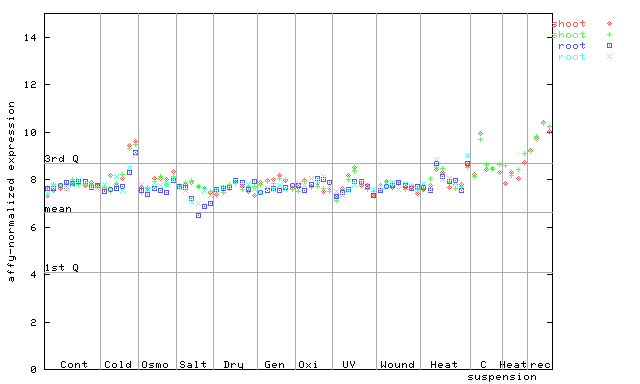
X axis is samples (pdf file), and Y axis is log2-expression. |
|||||||||||||||||||||||||||||||||||||||||||
| AtGenExpress* (Hormone) |
262851_at
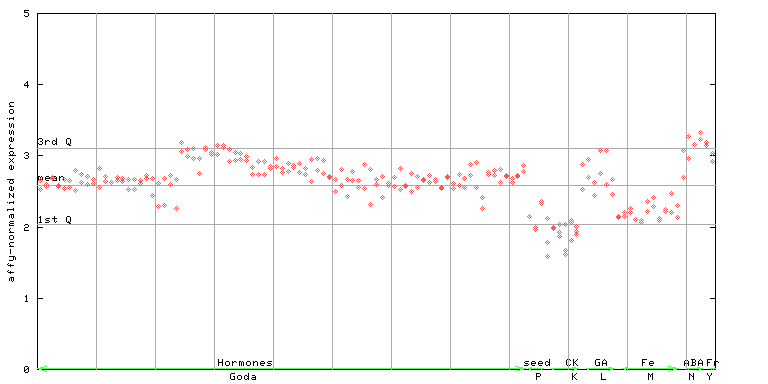
X axis is samples (xls file), and Y axis is log-expression. |
|||||||||||||||||||||||||||||||||||||||||||


")
| Link to other DBs | ||
| Entrez Gene ID | 838685 |
|
| Refseq ID (protein) | NP_001077571.1 | |
| NP_001322011.1 | |
|
| NP_001322012.1 | |
|
| NP_001322013.1 | |
|
| NP_001322014.1 | |
|
| NP_001322015.1 | |
|
| NP_173516.1 | |
|
The preparation time of this page was 0.2 [sec].