[←][→] ath
| functional annotation | ||||||||||||||||||||||||||||||||||||||||||||||||||||||||||||||||
| Function | FAD-binding Berberine family protein |


|
||||||||||||||||||||||||||||||||||||||||||||||||||||||||||||||
| GO BP |
|
|||||||||||||||||||||||||||||||||||||||||||||||||||||||||||||||
| GO CC |
|
|||||||||||||||||||||||||||||||||||||||||||||||||||||||||||||||
| GO MF |
|
|||||||||||||||||||||||||||||||||||||||||||||||||||||||||||||||
| KEGG | ||||||||||||||||||||||||||||||||||||||||||||||||||||||||||||||||
| Protein | NP_173965.1 | |||||||||||||||||||||||||||||||||||||||||||||||||||||||||||||||
| BLAST | NP_173965.1 | |||||||||||||||||||||||||||||||||||||||||||||||||||||||||||||||
| Orthologous | [Ortholog page] LOC732592 (gma) LOC732593 (gma) MEE23 (ath) AT4G20800 (ath) AT4G20820 (ath) AT4G20830 (ath) AT4G20840 (ath) AT4G20860 (ath) AT5G44360 (ath) AT5G44380 (ath) AT5G44390 (ath) AT5G44400 (ath) AT5G44410 (ath) AT5G44440 (ath) AT1G11770 (ath) AT1G26380 (ath) AT1G26390 (ath) AT1G26400 (ath) AT1G26420 (ath) AT1G01980 (ath) AT1G30700 (ath) AT1G30710 (ath) AT1G30760 (ath) AT1G34575 (ath) LOC4341253 (osa) LOC4341254 (osa) LOC4341257 (osa) LOC4341259 (osa) LOC4341261 (osa) LOC7457662 (ppo) LOC7471680 (ppo) LOC7471681 (ppo) LOC7480379 (ppo) LOC7480381 (ppo) LOC7480383 (ppo) LOC7480394 (ppo) LOC7480395 (ppo) LOC7480398 (ppo) LOC7480399 (ppo) LOC7480401 (ppo) LOC7480403 (ppo) LOC7480406 (ppo) LOC7480408 (ppo) LOC7480409 (ppo) LOC7480417 (ppo) LOC7480418 (ppo) LOC7484482 (ppo) LOC7485160 (ppo) LOC7485161 (ppo) LOC7485205 (ppo) LOC7489102 (ppo) LOC7489103 (ppo) LOC7489112 (ppo) LOC7489114 (ppo) LOC7489115 (ppo) LOC7489116 (ppo) LOC7489117 (ppo) LOC11406991 (mtr) LOC11407647 (mtr) LOC11415235 (mtr) LOC11415951 (mtr) LOC11416804 (mtr) LOC11418784 (mtr) LOC11420001 (mtr) LOC11422032 (mtr) LOC11422989 (mtr) LOC11424412 (mtr) LOC11429520 (mtr) LOC18095776 (ppo) LOC18096028 (ppo) LOC18103477 (ppo) LOC18103479 (ppo) LOC18103480 (ppo) LOC18103481 (ppo) LOC18103482 (ppo) LOC18103487 (ppo) LOC18103492 (ppo) LOC18103495 (ppo) LOC18103496 (ppo) LOC18103497 (ppo) LOC18103499 (ppo) LOC18103509 (ppo) LOC18103510 (ppo) LOC18103511 (ppo) LOC18103513 (ppo) LOC18105648 (ppo) LOC18109453 (ppo) LOC25486180 (mtr) LOC25486316 (mtr) LOC25486318 (mtr) LOC25486319 (mtr) LOC25492422 (mtr) LOC25493091 (mtr) LOC25493334 (mtr) LOC25493352 (mtr) LOC25493353 (mtr) LOC25493354 (mtr) LOC25493355 (mtr) LOC25493356 (mtr) LOC25493357 (mtr) LOC25493364 (mtr) LOC25493365 (mtr) LOC25493366 (mtr) LOC25495604 (mtr) LOC100775353 (gma) LOC100775893 (gma) LOC100776438 (gma) LOC100777594 (gma) LOC100778568 (gma) LOC100779395 (gma) LOC100780114 (gma) LOC100780461 (gma) LOC100781004 (gma) LOC100781731 (gma) LOC100782093 (gma) LOC100782292 (gma) LOC100782631 (gma) LOC100786800 (gma) LOC100788228 (gma) LOC100788233 (gma) LOC100794074 (gma) LOC100796276 (gma) LOC100796809 (gma) LOC100797188 (gma) LOC100797739 (gma) LOC100799990 (gma) LOC100800519 (gma) LOC100801058 (gma) LOC100802131 (gma) LOC100803041 (gma) LOC100807459 (gma) LOC100807998 (gma) LOC100810481 (gma) LOC100811019 (gma) LOC100811558 (gma) LOC100812087 (gma) LOC100813175 (gma) LOC100813706 (gma) LOC101246398 (sly) LOC101246685 (sly) LOC101249413 (sly) LOC101249763 (sly) LOC101254601 (sly) LOC101254908 (sly) LOC101254965 (sly) LOC101255262 (sly) LOC101255854 (sly) LOC101256448 (sly) LOC101263376 (sly) LOC101263972 (sly) LOC101264289 (sly) LOC101264571 (sly) LOC101264701 (sly) LOC101265002 (sly) LOC101265308 (sly) LOC101265606 (sly) LOC102662170 (gma) LOC103827902 (bra) LOC103827906 (bra) LOC103828799 (bra) LOC103828803 (bra) LOC103834173 (bra) LOC103839175 (bra) LOC103839178 (bra) LOC103839179 (bra) LOC103839182 (bra) LOC103839321 (bra) LOC103839322 (bra) LOC103840305 (bra) LOC103840312 (bra) LOC103840313 (bra) LOC103840613 (bra) LOC103840614 (bra) LOC103841228 (bra) LOC103843225 (bra) LOC103850258 (bra) LOC103857550 (bra) LOC103858368 (bra) LOC103858377 (bra) LOC103858400 (bra) LOC103858408 (bra) LOC103858430 (bra) LOC103858724 (bra) LOC103861201 (bra) LOC103861202 (bra) LOC103865354 (bra) LOC103867418 (bra) LOC103871928 (bra) LOC104645788 (sly) LOC104646055 (sly) LOC107275394 (osa) LOC108869423 (bra) LOC112323320 (ppo) LOC112323321 (ppo) LOC112323322 (ppo) LOC112323328 (ppo) LOC112323330 (ppo) LOC112324786 (ppo) LOC112324789 (ppo) LOC112325984 (ppo) LOC112329148 (ppo) LOC112421407 (mtr) LOC117125831 (bra) LOC120580904 (mtr) LOC123039084 (tae) LOC123043821 (tae) LOC123044031 (tae) LOC123048809 (tae) LOC123051687 (tae) LOC123051908 (tae) LOC123056682 (tae) LOC123069860 (tae) LOC123101225 (tae) LOC123104138 (tae) LOC123121890 (tae) LOC123151640 (tae) LOC123151641 (tae) LOC123151651 (tae) LOC123154502 (tae) LOC123154697 (tae) LOC123159831 (tae) LOC123160014 (tae) LOC123160305 (tae) LOC123160322 (tae) LOC123160325 (tae) LOC123160531 (tae) LOC123166878 (tae) LOC123166970 (tae) LOC123167086 (tae) LOC123167432 (tae) LOC123168236 (tae) LOC123169320 (tae) LOC123171182 (tae) LOC123172934 (tae) LOC123178742 (tae) LOC123182957 (tae) LOC123183295 (tae) LOC123184816 (tae) LOC123184818 (tae) LOC123396132 (hvu) LOC123407824 (hvu) LOC123409363 (hvu) LOC123411150 (hvu) LOC123411227 (hvu) LOC123411684 (hvu) LOC123413019 (hvu) LOC123421037 (hvu) LOC123425140 (hvu) LOC123425397 (hvu) LOC123429002 (hvu) LOC123429003 (hvu) LOC123429523 (hvu) | |||||||||||||||||||||||||||||||||||||||||||||||||||||||||||||||
| Subcellular localization wolf |
|
|||||||||||||||||||||||||||||||||||||||||||||||||||||||||||||||
| Subcellular localization TargetP |
|
|||||||||||||||||||||||||||||||||||||||||||||||||||||||||||||||
| Gene coexpression | ||||||||||||||||||||||||||||||||||||||||||||||||||||||||||||||||
| Network*for coexpressed genes |
|
|||||||||||||||||||||||||||||||||||||||||||||||||||||||||||||||
|---|---|---|---|---|---|---|---|---|---|---|---|---|---|---|---|---|---|---|---|---|---|---|---|---|---|---|---|---|---|---|---|---|---|---|---|---|---|---|---|---|---|---|---|---|---|---|---|---|---|---|---|---|---|---|---|---|---|---|---|---|---|---|---|---|
| Coexpressed gene list |
[Coexpressed gene list for AT1G26410] | |||||||||||||||||||||||||||||||||||||||||||||||||||||||||||||||
| Gene expression | ||||||||||||||||||||||||||||||||||||||||||||||||||||||||||||||||
| All samples | [Expression pattern for all samples] | |||||||||||||||||||||||||||||||||||||||||||||||||||||||||||||||
| AtGenExpress* (Development) |
261006_at
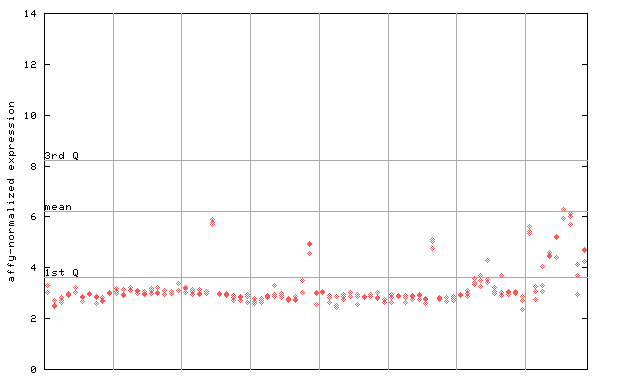
X axis is samples (pdf file), and Y axis is log2-expression. |
|||||||||||||||||||||||||||||||||||||||||||||||||||||||||||||||
| AtGenExpress* (Stress) |
261006_at
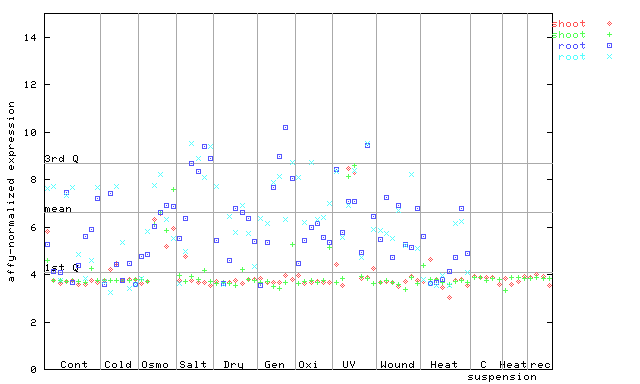
X axis is samples (pdf file), and Y axis is log2-expression. |
|||||||||||||||||||||||||||||||||||||||||||||||||||||||||||||||
| AtGenExpress* (Hormone) |
261006_at
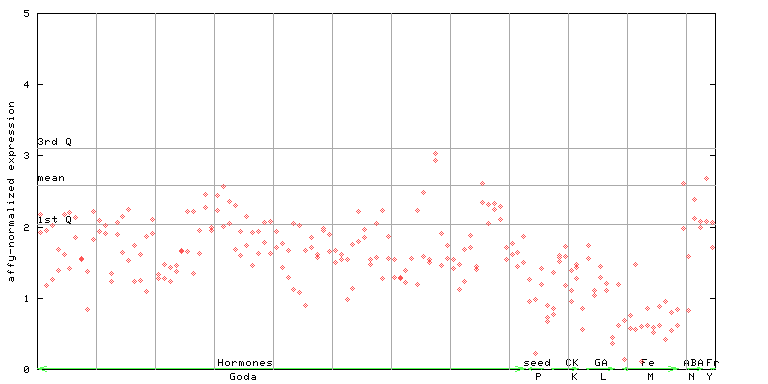
X axis is samples (xls file), and Y axis is log-expression. |
|||||||||||||||||||||||||||||||||||||||||||||||||||||||||||||||


")
| Link to other DBs | ||
| Entrez Gene ID | 839183 |
|
| Refseq ID (protein) | NP_173965.1 | |
The preparation time of this page was 0.1 [sec].