[←][→] ath
| functional annotation | ||||||||||||||||||||||||||||||||||||
| Function | photosystem I reaction center subunit N |


|
||||||||||||||||||||||||||||||||||
| GO BP |
|
|||||||||||||||||||||||||||||||||||
| GO CC |
|
|||||||||||||||||||||||||||||||||||
| GO MF |
|
|||||||||||||||||||||||||||||||||||
| KEGG | ||||||||||||||||||||||||||||||||||||
| Protein | NP_564561.1 | |||||||||||||||||||||||||||||||||||
| BLAST | NP_564561.1 | |||||||||||||||||||||||||||||||||||
| Orthologous | [Ortholog page] LOC4333999 (osa) LOC7478666 (ppo) LOC11415212 (mtr) LOC25485324 (mtr) LOC100800755 (gma) LOC101247619 (sly) LOC103871378 (bra) LOC123086988 (tae) LOC123090986 (tae) LOC123090987 (tae) LOC123096001 (tae) LOC123096002 (tae) LOC123447670 (hvu) LOC123447671 (hvu) | |||||||||||||||||||||||||||||||||||
| Subcellular localization wolf |
|
|||||||||||||||||||||||||||||||||||
| Subcellular localization TargetP |
|
|||||||||||||||||||||||||||||||||||
| Gene coexpression | ||||||||||||||||||||||||||||||||||||
| Network*for coexpressed genes |
|
|||||||||||||||||||||||||||||||||||
|---|---|---|---|---|---|---|---|---|---|---|---|---|---|---|---|---|---|---|---|---|---|---|---|---|---|---|---|---|---|---|---|---|---|---|---|---|
| Coexpressed gene list |
[Coexpressed gene list for AT1G49975] | |||||||||||||||||||||||||||||||||||
| Gene expression | ||||||||||||||||||||||||||||||||||||
| All samples | [Expression pattern for all samples] | |||||||||||||||||||||||||||||||||||
| AtGenExpress* (Development) |
261638_at
X axis is samples (pdf file), and Y axis is log2-expression. |
|||||||||||||||||||||||||||||||||||
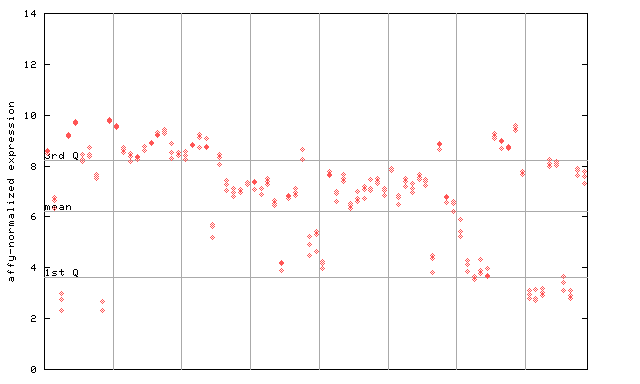
| AtGenExpress* (Stress) |
261638_at
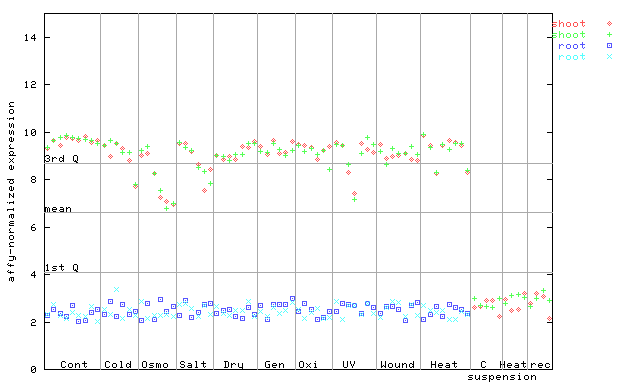
X axis is samples (pdf file), and Y axis is log2-expression. |
|||||||||||||||||||||||||||||||||||
| AtGenExpress* (Hormone) |
261638_at
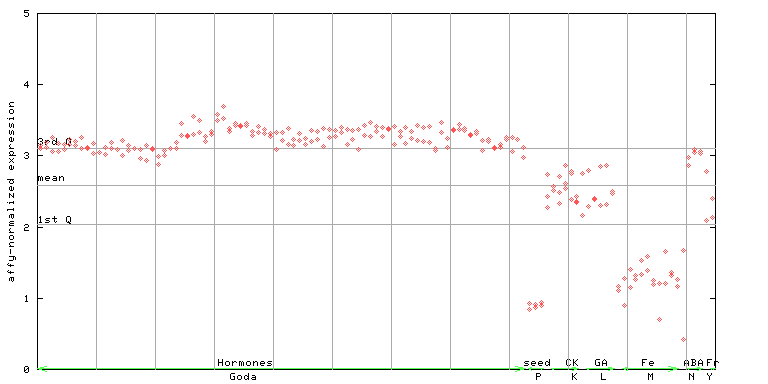
X axis is samples (xls file), and Y axis is log-expression. |
|||||||||||||||||||||||||||||||||||


| Link to other DBs | ||
| Entrez Gene ID | 841421 |
|
| Refseq ID (protein) | NP_564561.1 | |
The preparation time of this page was 0.1 [sec].