| reported seq | reported name | reference |
|---|---|---|
| no correspondence | ||
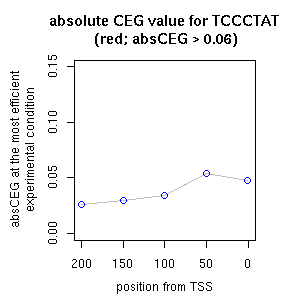
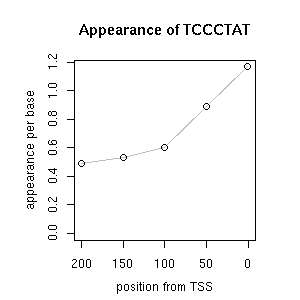
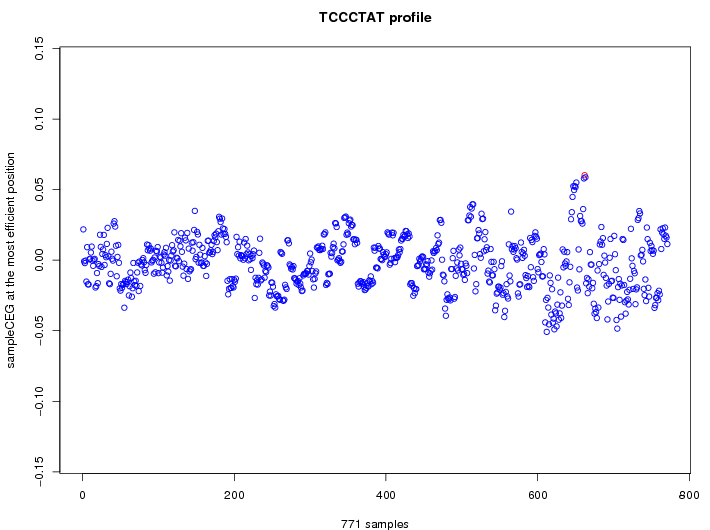
| |
|
| GO ID | term | -Log(p) | number of {A; genes in a GO} | numver of {B; genes with this heptamer} | {A} x {B} |
|---|---|---|---|---|---|
| no functional bias detected | |||||
| correl | TF | function ((alias))* | TF family (link to AGRIS) |
|---|---|---|---|
| 0.43 | At2g22900 | galactosyl transferase GMA12/MNN10 family protein | CAMTA |
| 0.41 | At2g23340 | AP2 domain-containing transcription factor, putative | AP2-EREBP |
| -0.40 | At2g18300 | basic helix-loop-helix (bHLH) family protein | BHLH |
|